Development of the Statistical "Which Character" Personality Quiz
Published: 7 August 2020
Updated: 6 January 2026
This page serves as the manual for the Statistical "Which Character" Personality Quiz (SWCPQ) plus the peer-report (SWCPQ-PR) and couples-report (SWCPQ-C) versions. The premise of the SWCPQ was to create a 'fictional character personality quiz' that takes the idea of matching people to fictional characters seriously, exploring the idea of what it even means for someone to 'be like' a fictional character. A secondary goal of the project is to create a bespoke dataset that can be used for teaching basic psychometric analysis or exploring deep questions about how people respond to survey questions.
Background
Since 2011, I (your author) have published personality tests on the internet. When I told people that, I would often get asked something along the lines of "Does that mean you work at BuzzFeed writing the quizzes that tell you what character you are?". And I would have to reply that, no, I am more interested in science and human nature than entertainment; those quizzes are fun, but not that meaningful. And that is not a criticism of BuzzFeed! The value of BuzzFeed (and all other sources of which character tests) are proven by their popularity. They are fun games. People enjoy taking them: case closed. However, if you are interested in the question of how to make good psychological measures, I assumed they never offered much that was interesting to think about.
Fictional character tests like the ones that were common on the internet in the 2010s era would typically have 3-8 characters (from a specific fictional universe) and a fairly small number of questions, maybe 10-30. And each of those questions would key towards one of the characters, with an equal number of questions per character. The questions on the quiz would just be made up on the spot by the person writing it according to what made sense to the quiz's author. For example, when writing a quiz, the author might think 'what is a question Harry Potter might answer yes to?' and then add that question to the scale for the Harry Potter result. This process always seemed a little bit arbitrary to me though.
In 2019 while thinking about the popularity of such tests on the internet, I had the idea of representing each character as a vector which could be populated by crowdsourced data. Test users could then be represented as a vector of their own. Using very basic machine learning algorithms like cosine similarity, the user could be matched to the character vectors. This had several advantages over the traditional technique:
- By moving to the idea of crowdsourcing, the idea of which questions score towards a certain character becomes a little less arbitrary. There are still thorny philosophical questions here, like can characters even have a 'personality' that is comparable to a human personality?
- By moving away from a specific question scoring for a specific character, a practical limit on the depth of the quiz was removed. For example, if you made a quiz with 10 characters and each character had to have 4 questions, then that quiz needs 40 questions. Then if you wanted to add 10 more characters you would have to double the length of the quiz. Using the vector similarity approach, the quiz could be scaled up indefinitely.
Since its creation the SWCPQ has gone on to be extremely popular and I have put hundreds of hours of work into it. I have put a lot of work into refining the algorithm and collected a very rich dataset (much richer than needed just to build the quiz). This whole project has actually given me a lot of interesting things to think about, and even revealed a few important things about how people interpret and respond to survey items. Data collected as part of this project has been used in several published academic articles. So I retract my previous prejudice against the whole idea of a "What Character Are You Quiz". Personality quizzes that tell you what character you are are great. I should have started making them way sooner!
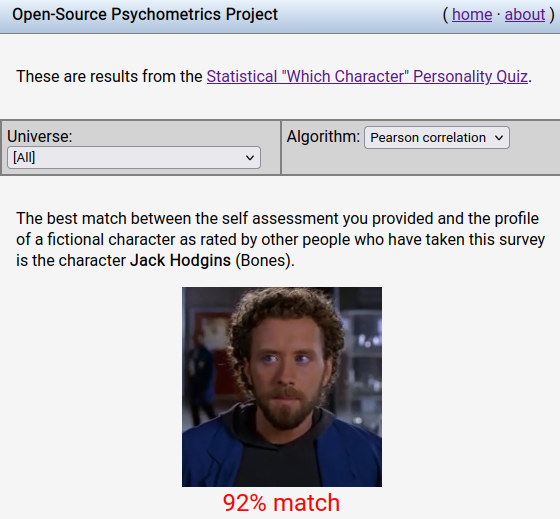
And at the end of it all, I got to find out what character I am most like:
Collecting the ratings of characters
Instead of the test creator deciding what each character's profile should be just based on their opinion, the opinions of a large number of people would be averaged to produce the character profiles.
The format of a 100 point scale was chosen that is anchored on either end by an adjective.
To start, the test dataset was populated with volunteers from reddit (starting with Game of Thrones and Harry Potter characters), but once a workable version of the test was operational, the database has been self-sustaining with volunteers recruited from people taking the test. After a user has answered the personality rating survey but before they have viewed their results they are asked if they would be willing to rate some characters. There is about a 35% opt-in rate. Volunteers are then asked to select any fictional universes they know about from a list, and then the characters from that universe are paired with items from the set of features (usually randomly) and they rate them. Afterwards, a few more questions are asked about the user's relationship to that fictional universe and some demographic questions. The survey where the characters were rated has varied over time, but mostly has looked like the below screenshot.
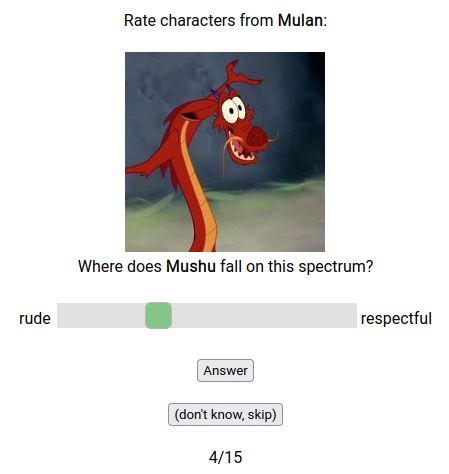
The scale goes from 1 (far left) to 100 (far right). The user did not receive instruction on this in the rating survey, but during the body of the quiz they did use similar slider scales to rate themselves that did display the numerical values and so the user should have made the connection and had an understanding of what the scale was. The number of ratings a particular user would give has changed over time. Originally users were assigned to do 30 ratings, but this seemed to be too many so currently users are assigned to do 20 unless it is for a universe where data is rare then they are assigned 25.
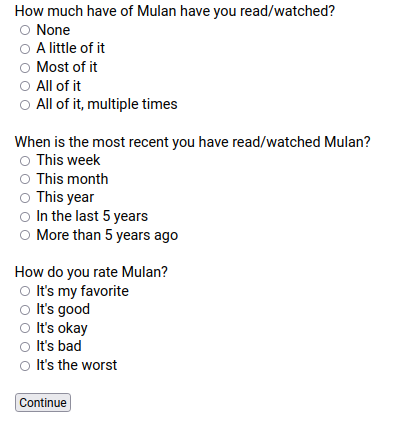
After this, a few questions that are to help evaluate that user's relationship to the work were asked, pictured below.
Then finally, some demographic questions were asked to put the sample in context, pictured below.
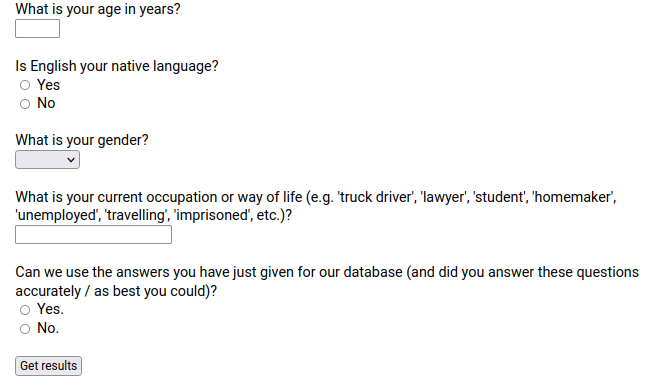
This was the last page of the volunteer survey and after it was submitted users were directed immediately to their results. This page also collected consent to use the user's data as its final question. Users who do not answer yes to this question have their data discarded.
Using this procedure, a very large number of ratings have been collected. The graph below shows number of completed surveys per day since this quiz was converted to the current workflow.
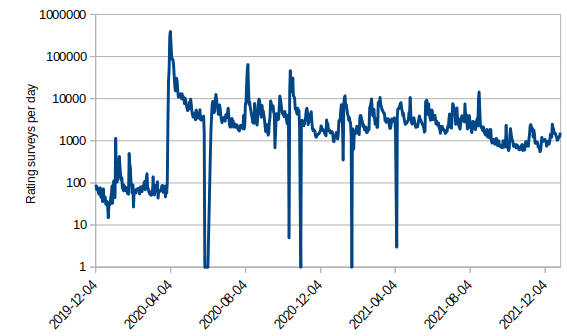
With each user providing up to 30 character ratings in one survey, a total of more than 69,496,000 ratings spread across 400 items for 1,750 characters have been made. These have been somewhat unequally distributed as the more commonly known universes receive more ratings, but care has been taken so that each item for every character in the database has received at least 3.
Generating the bipolar scales
The item format for the quiz and dataset was chosen to be a 1 - 100 scale anchored with text on both ends. This is not a super common format in psychological measurement, in fact rating scales with sliders have significant problems that I have previously criticized them for. The reason why this format was chosen was due to user experience considerations. To make how the quiz works understandable to users, the results page needs a graph, and the graph looks better with high granularity. If user responses were just on a 1 - 5 scale for example, a scatter plot made out of them would look very clumpy.
The items were generated by your author over time, currently up to 525. This is far more items than actually can be used in the quiz. A 525 question quiz would be way too long. But having all these items allows us to evaluate and select the best performing items. It has to be true that some questions are better than others. And a large set of diverse items will be neccesary to undercover the best way that characters can be represented. This also makes the dataset more useful for educational purposes.
One way to evaluate how good an item is just how good it seems. And this method is more or less how other character tests are made, the creator puts in questions that just seem good to them. As explained earlier, the judgment of many is better than the judgment of one. So here, this issue was crowdsourced to test users in a survey that looked like below.
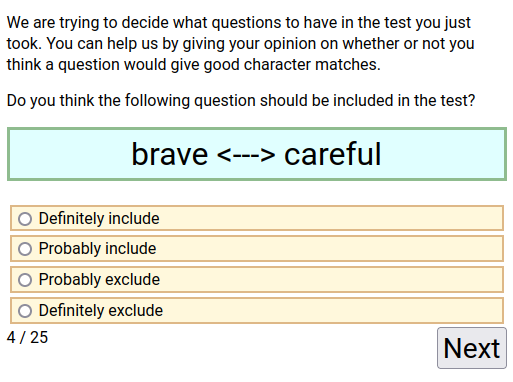
This survey was run until at least 500 people had given their opinion on each question. The questions with the highest and lowest average scores are below (4=Definitely include; 1=Definitely exclude).
| Most liked questions | Least liked questions | |||
|---|---|---|---|---|
| Score | Item | Score | Item | |
| 3.62 | hesitant or decisive | 1.53 | Italian or Swedish | |
| 3.6 | impulsive or cautious | 1.64 | German or English | |
| 3.59 | idealist or realist | 1.64 | French or Russian | |
| 3.59 | forgiving or vengeful | 1.75 | 💃 or 🧕 | |
| 3.59 | extrovert or introvert | 1.81 | 🐮 or 🐷 | |
| 3.58 | optimistic or pessimistic | 1.85 | 💩 or 🌟 | |
| 3.58 | emotional or logical | 1.91 | 🐐 or 🦒 | |
| 3.57 | secretive or open-book | 1.91 | moist or dry | |
| 3.55 | confident or insecure | 1.93 | genocidal or not genocidal | |
| 3.53 | scheduled or spontaneous | 1.95 | 🐩 or 🐒 | |
| Complete list for all items: characters-items-liked.csv | ||||
Checking the reliability of user ratings
The premise of this quiz is that aggregating different user's ratings together increases their accuracy, but that is an assumption that could not be true. For example, if character personality is completely in the eye of the beholder and has no consistency across different raters then the idea of any 'which character' personality quiz is pointless. This question is known as interrater reliability. It will only make sense to talk about a character being a certain way if people agree that the character is that way. This is usually quantified with an intraclass correlation coefficient (ICC1). The value of ICC ranges from 0 to 1. With 0 being no agreement and 1 being perfect agreement. The 10 questions with the highest and lowest interrater reliability are in the table below.
| Most reliable items | Least reliable items | |||
|---|---|---|---|---|
| ICC | Item | ICC | Item | |
| 0.665 | masculine (not feminine) | 0.01 | 'right-brained' (not 'left-brained') | |
| 0.626 | young (not old) | 0.043 | tautology (not oxymoron) | |
| 0.598 | cruel (not kind) | 0.05 | Coke (not Pepsi) | |
| 0.592 | heroic (not villainous) | 0.076 | Greek (not Roman) | |
| 0.569 | rich (not poor) | 0.086 | western (not eastern) | |
| 0.555 | scruffy (not manicured) | 0.097 | proactive (not reactive) | |
| 0.548 | playful (not serious) | 0.097 | empirical (not theoretical) | |
| 0.543 | sporty (not bookish) | 0.101 | libertarian (not socialist) | |
| 0.53 | tall (not short) | 0.117 | 🤔 (not 🤫) | |
| 0.53 | angelic (not demonic) | 0.117 | objective (not subjective) | |
| Complete list for all items: characters-items-icc.ods | ||||
Some questions were much more reliable than others. Some questions had very low reliability and looking at them, it makes sense. The low reliability items all do seem kind of confusing. The question that showed the lowest reliability is the contrast between being 'right-brained' and 'left-brained'. This question is a reference to the pop-psych personality idea that people prefer to use one side of their brain and that each side has specific functions. The low consistency of ratings made on this question matches up with my previous experience working with the idea. I attempted to create my own measure of being left-brain versus right-brain back in the day, and found that it was mostly an incoherent/meaningless idea. Everyone's definition of what they thought it meant to be left or right brain varied too widely to be useful at all. See Development of the Open Hemispheric Brain Dominance Scale.
We can graph the reliability of each question versus the average rating a question received in the survey where users were asked what questions they thought should be used for the quiz. Some of the points have been labeled to help with interpretation.
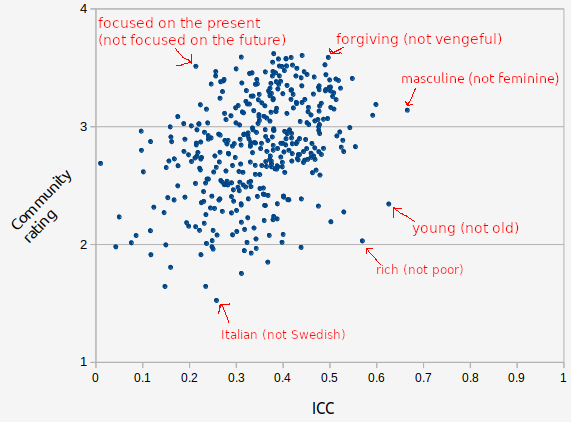
The correlation between these was positive, but modest (r=0.37). Looking at the individual points, we can see why this makes sense. Users were generally able to tell which questions were meaningless and agreed they should not be used in the test. Some questions were outliers, where it was reliable but still got low user approval. One of these was the item young (not old). It is the 2nd most reliable question, but got a very low user scores. And this make sense, users don't dislike this question because it is meaningless, they dislike it because its not about personality. So you can see how this demonstrates that it is important for a question to be reliable, but reliability is not the only criteria.
Causes of unreliability
So far we have been thinking about this in a way that is more or less "Classical Test Theory" (Charles Spearman, 1904), the basic equation of which is Observed Score = True Score + Error. We take a lot of measurements, average them, and that average is closer to the "true value" the larger the sample size. We saw that the intraclass correlations for all of the items were mostly pretty good, so that is seeming reasonable. But the assumptions of classical test theory are not true if different groups of people respond to an item in systematically different ways. Look at this graph of the rating distribution of the ratings people made of the character Darth Vader when they were asked to place him on the scale from sherrif <-> outlaw.
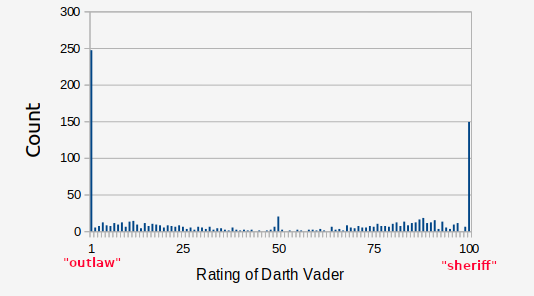
This is the character/scale combination the shows the highest computed standard deviation in the entire dataset. People rate Darth Vader as either an extreme outlaw, or an extreme sherrif, and not inbetween. If you average the ratings of Darth Vader you get a score near 50, but almost no one individully places him there! The item sherrif <-> outlaw has an above average ICC, but in this specific instance their is no central tendency for this feature.
When people sit down to respond to a survey item, their interpretation of that survey item depends on their perspective. I'll guess that in this case, there is an issue around if people think about the character Darth Vader just in terms of the first movie or in terms of the whole arc of the universe. In the first movie he is pretty sherrif. He works for the government chasing down rebels. If you think about him in his larger character arc where he betrays the jedi, kills the younglings, etc. then he does seem to quite a bit more outlaw.
As a practical issue, representing Darth Vader as a 50 on this feature is reasonable for the matching algorithm. The actual thing that is happening is closer to "Sherrif vs. Outlaw does not apply to this character and it should be treated as a missing/invalid feature but for the algorythim scores near the middle have the smallest effect so the practical influence of this on matching scores in negligible.
Modeling the ratings of character personality
So, we have all these ratings of characters and we might want to ask, "what is the best model of a characters personality?" The dataset contains 400 values for each character, but probably some of these values are redundant? You could probably well describe characters with far less than 400 values per character. The typical analysis to do this in psychometrics is called factor analysis. Factor analysis tries to explain a larger set of observed values with a smaller set of fundamental causes.
When you run a factor analysis, the first thing you look at is the "scree plot". Factor analysis extract factors one at a time, each time trying to make the factor extracted do as much work as possible, so each sequential factor does less work than the previous. You can look at how much variance each factor explains and then kind of make a judgment call about how many are important. The scree plot from a factor analysis of the 400 values for 1,600 characters is below.
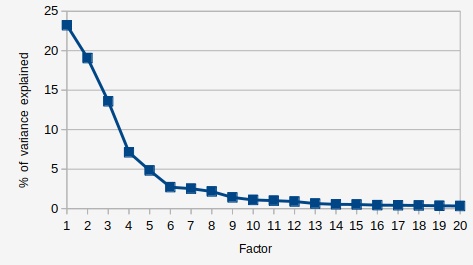
Interpreting a scree plot is more art than science, but I am going to say that I see 8 factors that appear to be doing work here. So for the rest of the analysis in this section I am going to only consider the first 8 factors extracted. A factor analysis computes the loading of each variable on each factor. The loading is what the analysis estimates the correlation of that variable with the factor is. So we can look at the variables with the highest loading to try and interpret what each factor "is". The table below shows the loadings of the top few items that load on each factor.
| Feature | Factor loading | |||||||
| 1 | 2 | 3 | 4 | 5 | 6 | 7 | 8 | |
| cruel (not kind) | 0.97 | -0.01 | 0.07 | 0.06 | 0.01 | -0.01 | 0.03 | -0.01 |
| poisonous (not nurturing) | 0.96 | 0.12 | -0.03 | 0.05 | 0.02 | -0.01 | 0.07 | 0.02 |
| angelic (not demonic) | -0.95 | -0.17 | -0.09 | 0.02 | 0 | 0.01 | -0.05 | -0.02 |
| scheduled (not spontaneous) | 0.04 | -0.92 | 0.04 | 0.17 | -0.17 | 0.04 | 0 | 0.02 |
| serious (not bold) | 0.01 | -0.9 | -0.07 | -0.02 | -0.09 | -0.06 | 0.24 | 0 |
| orderly (not chaotic) | -0.28 | -0.87 | 0.18 | 0.21 | -0.06 | -0.05 | -0.05 | 0.01 |
| noob (not pro) | 0.05 | 0.08 | -0.9 | -0.04 | 0.06 | 0 | -0.02 | -0.08 |
| mighty (not puny) | -0.06 | -0.02 | 0.9 | 0.01 | 0.19 | 0.03 | 0.07 | -0.08 |
| badass (not weakass) | -0.15 | 0.15 | 0.89 | -0.07 | 0.09 | 0.03 | 0.04 | -0.01 |
| scruffy (not manicured) | 0.02 | 0.31 | -0.04 | -0.86 | 0.04 | -0.07 | 0.12 | -0.01 |
| blue-collar (not ivory-tower) | -0.31 | 0.05 | 0.01 | -0.83 | 0.16 | 0 | -0.02 | -0.03 |
| proletariat (not bourgeoisie) | -0.4 | 0.09 | 0.05 | -0.82 | 0.02 | 0 | 0.05 | 0.02 |
| sporty (not bookish) | 0.13 | 0.36 | 0.18 | -0.21 | 0.84 | -0.02 | -0.04 | -0.03 |
| nerd (not jock) | -0.27 | -0.22 | -0.3 | 0.06 | -0.8 | 0.07 | -0.02 | 0.15 |
| intellectual (not physical) | -0.14 | -0.39 | 0.1 | 0.27 | -0.79 | 0 | 0.03 | 0.14 |
| leisurely (not hurried) | -0.07 | 0.45 | 0 | 0.01 | -0.01 | -0.77 | -0.18 | -0.1 |
| sleepy (not frenzied) | -0.29 | -0.24 | -0.25 | -0.16 | -0.02 | -0.74 | 0.1 | -0.04 |
| aloof (not obsessed) | -0.38 | 0.1 | -0.04 | -0.11 | 0.16 | -0.67 | -0.08 | -0.08 |
| sad (not happy) | 0.53 | -0.23 | 0 | -0.1 | -0.04 | 0.05 | 0.76 | -0.01 |
| cheery (not sorrowful) | -0.48 | 0.36 | -0.12 | 0.15 | 0.02 | -0.01 | -0.73 | 0.01 |
| traumatized (not flourishing) | 0.38 | -0.02 | -0.26 | -0.26 | 0 | 0.16 | 0.68 | 0.02 |
| luddite (not technophile) | 0.09 | 0.04 | -0.07 | -0.19 | 0.18 | -0.06 | 0 | -0.91 |
| high-tech (not low-tech) | -0.02 | -0.07 | 0.23 | 0.29 | -0.19 | 0.1 | 0.01 | 0.86 |
You can read the table and see that when describing characters, people talk about how cruel, spontaneous, mighty, scruffy, nerdy, high-energy, sad, and high-tech a character is and these descriptions are independent. And this maybe kinda makes sense and seems reasonable. However, I am partial to the phrase "factor analysis is uninterpretable" (stolen from Tal Yarkoni). I think results of a statistical analysis are only interpretable in the context of a theory and I have no theory of character personality — and, I don't think there could ever be one.
So rather than a scientific model, we will focus on the less ambitious goal of a predictive model. And the thing we will aim to predict is how much a user thinks they are like a specific character based on their questionnaire answers. In a sense this will be like a recommendation engine that recommends users characters, and the criteria for good results is that the user agrees that the recommended characters are similar to them.
Exploring validity using height as a criterion
There is one trait where it might actually be reasonable to talk about a character having a true value of it. For characters played by actors (i.e. not animated, etc.), the actor who played that character has a measurable height and the description of being tall vs short (P69) can be said to be directly downstream from that. I scraped the height listed for actors on Imdb and cross referenced it with the ratings for their characters in our dataset:
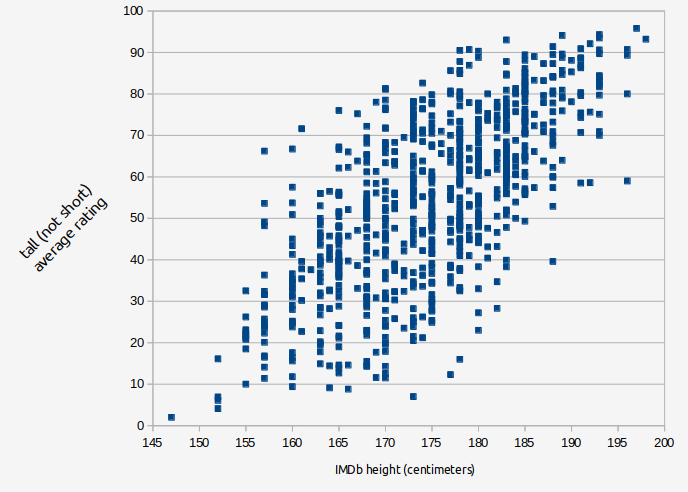
The correlation between the actor's height as listed on IMDb and the tallness rating of their character in our dataset was correlated at r=0.693. And remember that the true value of the relation between these two things is higher than the calculated value because of unreliability. Its value will get higher as more data is collected.
How the correlation increases with more ratings can be demonstrated with a simulation. Using the cases where there were at least 100 ratings (n=249), the effect of sampling only a certain number of ratings was investigated. The results are graphed below.
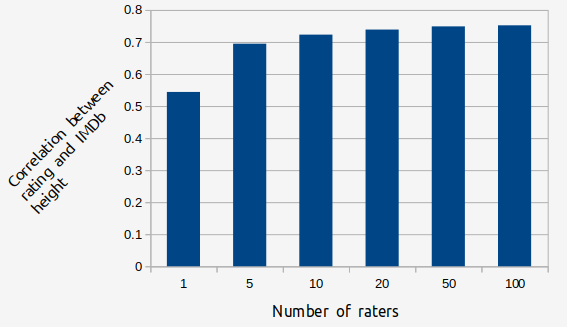
You can see that if a character's rating is only based on one rating, the correlation is r=0.544, but if its based on 100 rating, it jumps to r=0.751. The benefit of addition additional ratings is very large at the beginning, but after characters have 10 ratings for a trait the marginal benefit of one more rating gets very small.
If you projected this out and imagined that an infinite number of ratings were collected (i.e. that the average of the ratings had no unreliability left in it), it looks like the trend is to approach r=0.76.
There are other sources of unreliability in the comparison that we need to acknowledge too. The heights as listed on IMDb do not appear to be perfectly accurate. Let's investigate one outlier on the graph:
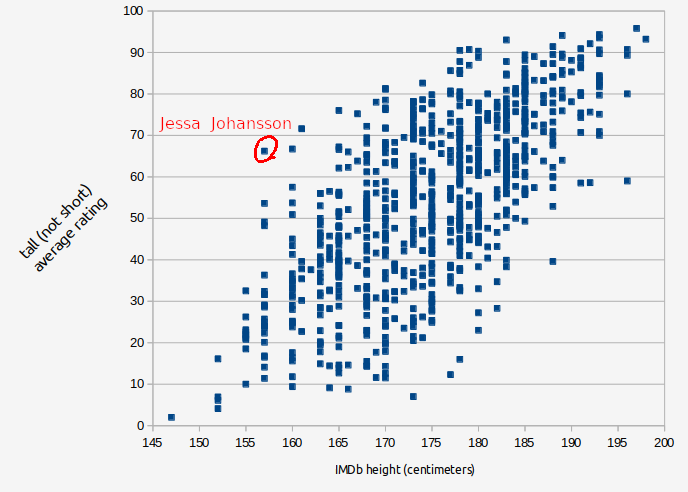
Jessa Johansson from the TV show Girls has been rated by n=37 users on tall (not short) and the average was 67.2 (meaning somewhat towards the tall end of the scale). This character is played by actress Jemima Kirke who was listed on IMDb as being 5' 2" (1.57 m), which is quite short. So one of these values seems like they should be wrong. And so, when we look at sources other than IMDb, there does seem to be some disagreement out there. CelebWikiBiography.com says "Her height is 5 feet 2 inches or 5 feet 4 inches or 5 feet 5 inches".
We can compare her to Lena Dunham, a fellow actor in Girls. Dunham is listed on IMDb as being 5'3", an inch taller than they list Jemima Kirke! But in our data, Hannah Horovath gets 15.6/100 for tall compared to 67.2/100 for Jessa Johansson. If we look at photos of them side by side, Kirke (blue) does look a fair bit taller than Dunham (red).
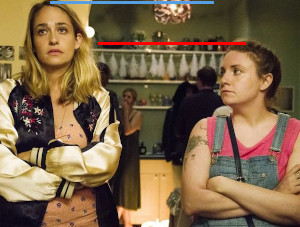
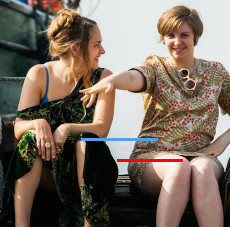
So my conclusion is that Kirke probably is more like 5'5" and that the correlation between actual and rated height would be higher if IMDb was better at reporting actual heights.
It's hard to estimate how much having perfectly reliable height data would increase the correlation, but my guess is probably not that much (on average I expect IMDb to be pretty accurate). So we still have the question, why is the correlation not r=1 when correcting for unreliability? Isn't the idea of this test that if we average together people's ratings we get the "true score"?
This is where have to start considering the issue of what in psychometrics is called "measurement invariance". This will be the most challenging philosophical problem for this character matching system. Measurement invariance is when what seems to be the same measure (here, the same question) produces responses that have different meanings when used in different populations or different contexts. For example, when rating the height of characters short <--> tall, there is a measurement invariance issue around the gender of the character. See the same graph we saw before, now broken down by gender:
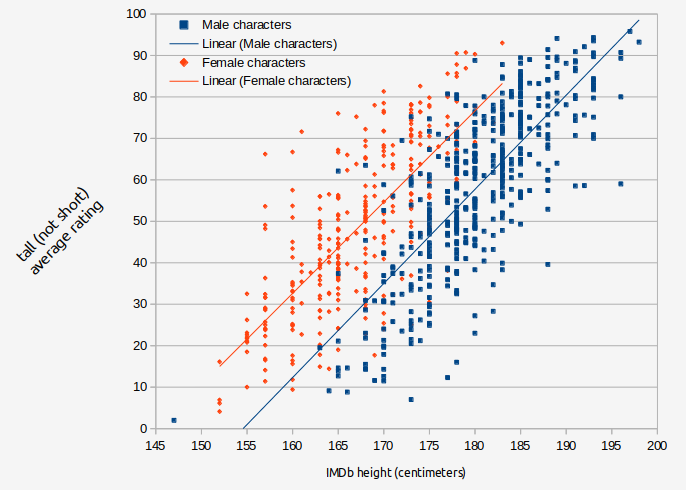
People use a different standard to decide whether a female character is tall than they use to decide for a male. This makes intuitive sense and you can probably recognize this in your own thinking: a woman 6 feet tall is very tall for a woman, so you might remark about how tall she is, but a man six feet tall is not particularly tall for a man. If you control for the gender of actor/character the correlation between actor height and rated character tallness increases from r=0.693 to r=0.749.
This idea of measurement invariance will be addressed much more in depth when we get to the section on tuning the algorithm. But for now, we can say having people rate characters does seem to be a reliable method, though not a perfectly valid one.
Predicting user-character similarity ratings
So, as we saw above there are philosophical issues with the idea of "you think you are an extrovert and people think Mr.Character is an extrovert, therefore you are like Mr.Character". So, let's try moving away from statistics and into data science, pure number crunching. Instead of a psychological assessment, let's try conceptualizing what we are doing as a recommendation engine with the target of maximizing user identification. The main tool used here is the question shown below:
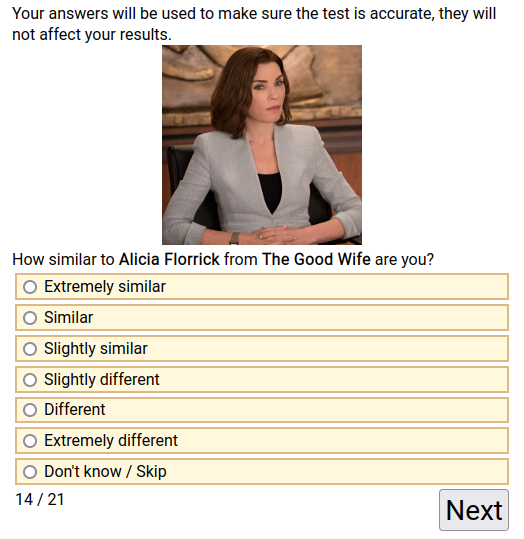
Users who agreed at the end of the test to rate some characters to make the test better were directed to select from a list of fictional universes which ones they knew. Then they were shown a random assortment of characters from those universes and asked to rate how similar each was to them on a six point scale from 1=Extremely similar to 6=Extremely different (they could also skip a character if they did not know).
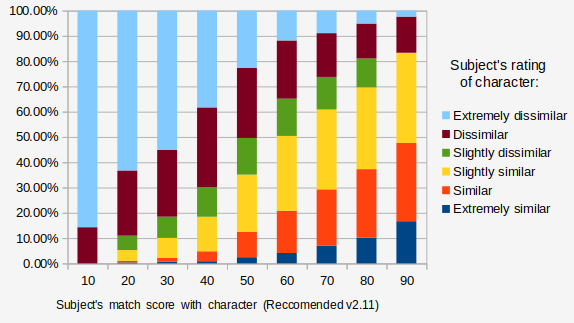
Using data from the self-character similarity survey, a selection of items was tuned to maximize the correlation between match score with character and users self-identification with character. Its performance is graphed below.
Scoring
The current active version provides match scores that range from 0-100. To produce that score, the correlation is computed between the average rated scores for each character and the self ratings provided by the user. This correlation ranges between -1 and 1, so to turn it into a percent, 1 is added to that number and multiplied by 50. The mean difference algorithm takes the average difference between a users score and the characters scores and subtracts that from 100. Scores on the versions of the test with more questions tend to be lower for the best matching character that the versions with less. The more criteria you have, the more difficult it is to find a perfect match.
Comparison of others method of matching characters
Now that we have made and validated this matching system, we should put it in context by comparing it to other similar systems.
Myers-Briggs Personality Types
There are thousands of 'which character' quizes on the internet but they are not usually taken seriously enough to provide any information about how they work. But there is one alternative method of matching people to characters we can make a detailed comparison with: Myers-Briggs personality types. Myers-Briggs, or Jungian type, is a system of 16 personality types. It is the most popular system on the internet, and one of the common uses of the system is to type fictional characters. A common format is for someone to make a chart of the characters from a fictional universe and pick out one example they think fits each each of the 16 types. This usually looks like the meme below which shows a typing of Star Wars characters (from Entertainment Earth News):
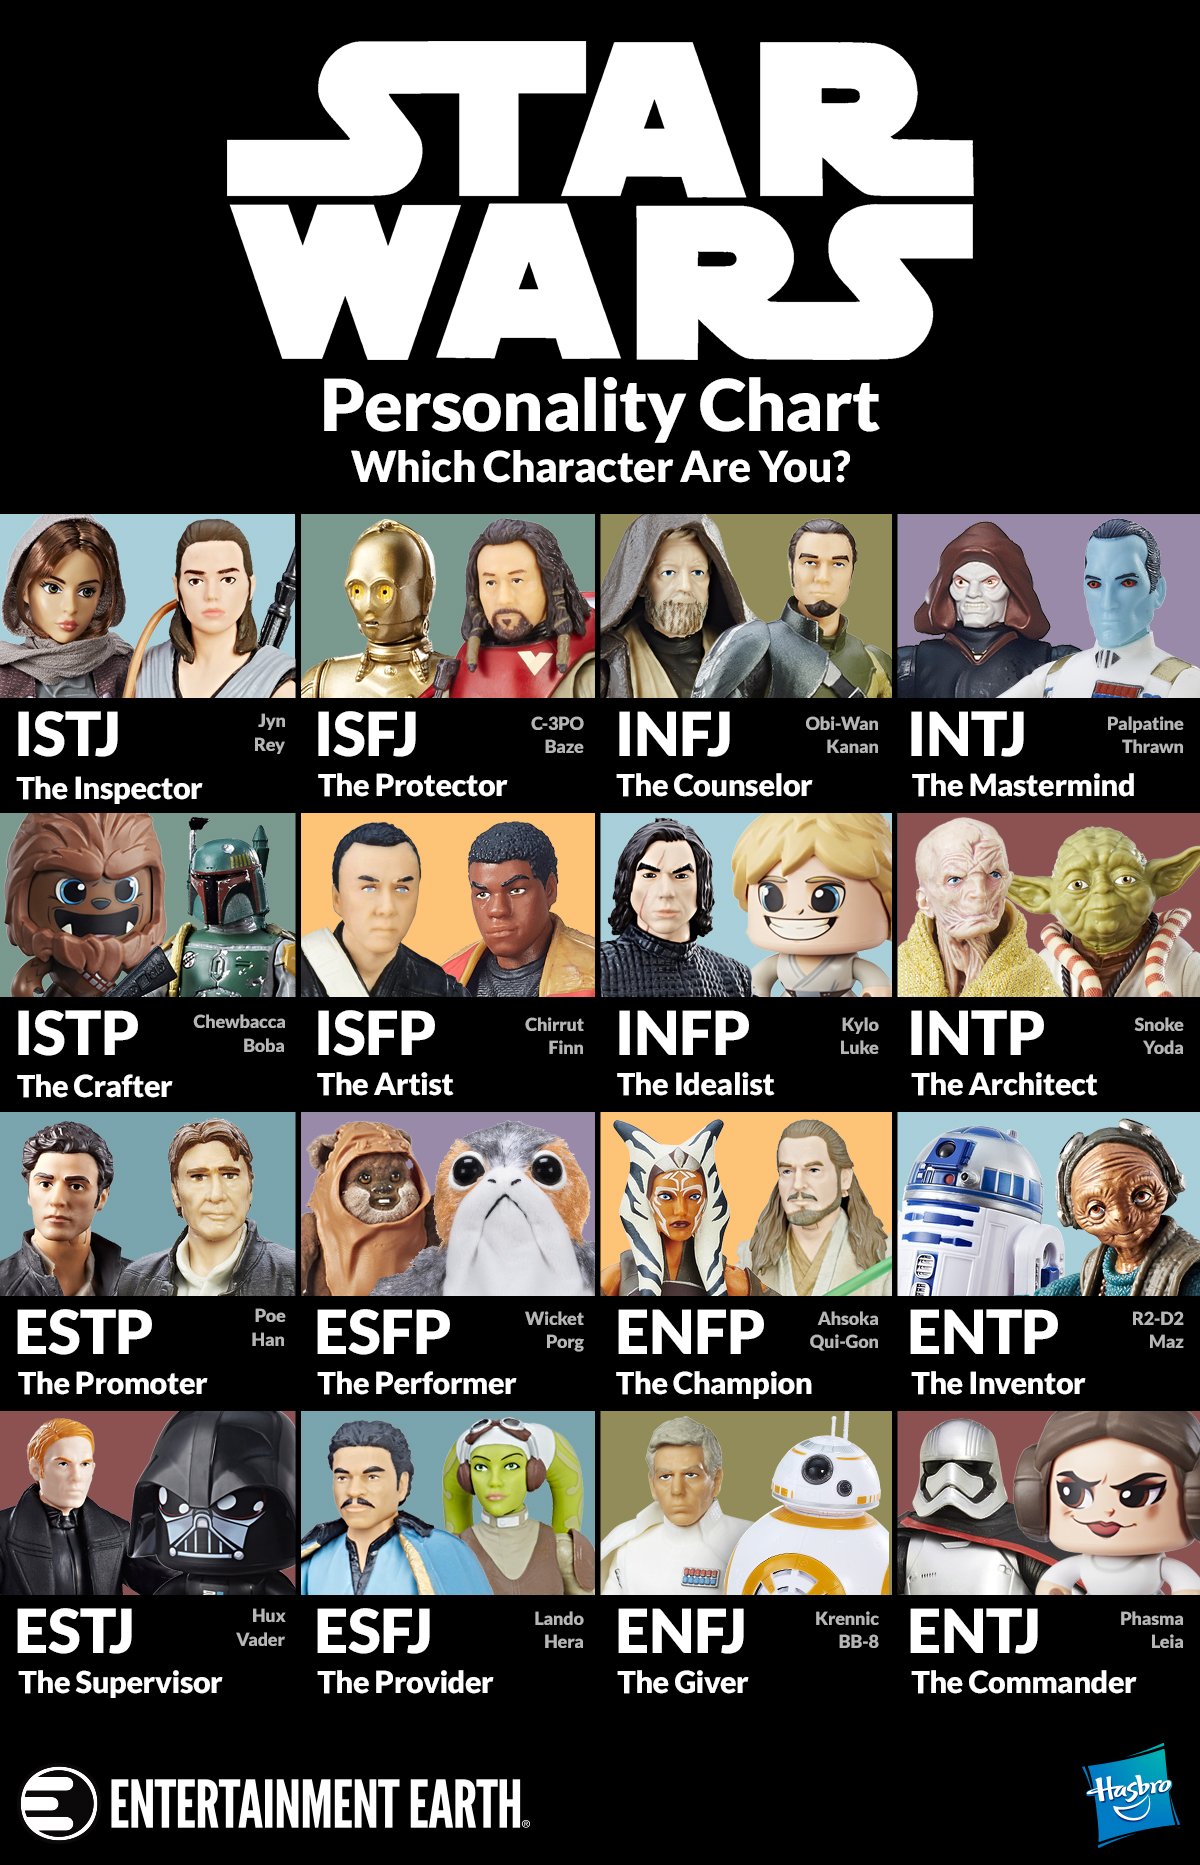
The implication of these memes is that you should use your personality type to look up what character is similar to you. It is assumed that if you identify as an INFP, you then must have the most connection to the character that has been chosen as an example of an INFP, etc.
The question for us here is, can we quantify how well does this work? And, can we compare how well this works versus matching people to characters using the SWCPQ questionnaire?
The website Personality Database (PDB) functions somewhat similar to this website. Users rate characters on their Myers-Briggs and Enneagram personality types and these are all combined into a community verdict. PDB is the most popular Myers-Briggs community typing website, and its verdicts will be used in this analysis as the key for what type each character is under the Myers-Briggs system. Of the 1,600 character profiles in the SWCPQ1.0 dataset, there are 1,537 with matching profiles on PDB.
The validation survey run here also asked for a user's Myers-Briggs type, so we can cross reference these two datasets to see how well matching an individual to a character based on Myers-Briggs type works. First we will start with analyzing just one character at a time to illustrate how this works, then afterwards move on to analyzing all characters at once to compare the two methods.
Two of the characters with the most data in the validation dataset are Anna of Arendelle and Hermione Granger. For each of them we have many thousand people who both self-reported a Myers-Briggs type and rated how similar they were to the character. The graphs below shows what percent of each Myers-Briggs type gave each different rating of similarity to them.
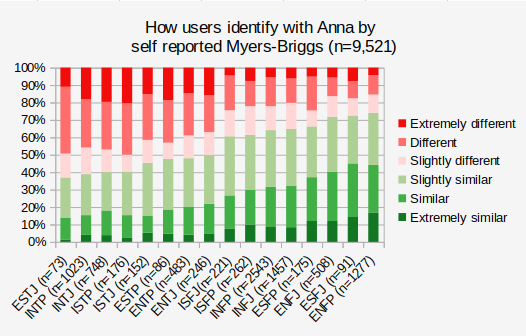
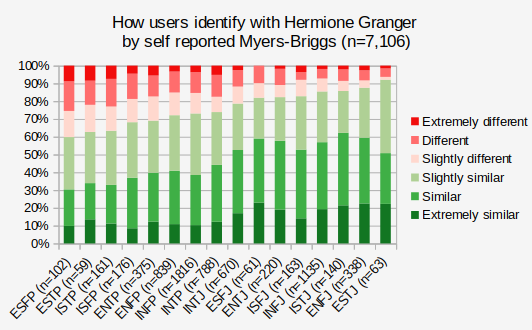
We can see that when we categorize people by Myers-Briggs type, not all types have the same relation to the characters. People who identified as ENFP were most likely to say they were like Anna and people who identified as ESTJ were most likely to say they were similar to Hermione Granger. And if we go on personality database we see that those are the exact types that people have voted for Anna and Hermione! So, does this prove that the Myers-Briggs types are legit? My position is that Myers-Briggs type theory / Jungian psychology is pseudoscience, but the 16 types can be used as adjectives and describing things with adjectives is a reasonable thing to do. Indeed, Francis Galton counted more than a thousand words in the dictionary that could be used to describe people, and we can say Myers and Briggs added 16 more. They question to ask is how useful are these adjectives, how much work do they do?
Yes, 90% of ISTJs thought they were some degree of similar to Hermione, but the majority of the ESFPs (the type that thought that the least) still thought that.
So that looks like it checks out. PDB says Anna is an ENFP and self identified ENFPs are one of the types most likey to think they are similar to Anna. But also see that it is far from perfect. Some ENFPs did not think they were similar to Anna, and many people from all of the other types thought they were.
But that was just one character. We want to know how the system performs across all characters. There were 407 characters in the validation dataset that had at least 50 votes on Personality-Database.com, this analysis will only use those. In total 57,774 users provided a total of 718,995 ratings. The graph below shows how those ratings differed between when the user's type and the character's type matched, versus when they did not.
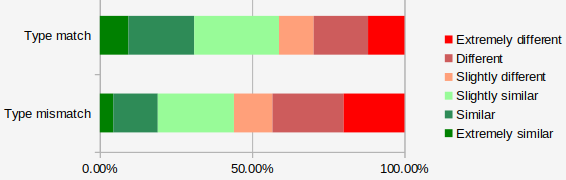
When a user's type matched the characters type, the user thought the character was similar to them 58.8% of the time versus 44.0% of the time when the types did not match. So matching to characters based on Myers-Briggs type does better than chance, but does not compare very well to how well this tool performs. Go back and look at the graph of how well match scores from this questionnaire predict whether or not a user will rate a character as similar to them: when a user matched to a character at the lowest level, there was a less than 10% chance they would think that the character was similar to them, versus an 80% chance when the matching score was at the high end.
But, that the MBTI would not function that well at matching people to characters is no suprise. The Myers-Briggs Type Indicator was designed to recommend careers, not characters. One specific example of how this effects things is that the Myers-Briggs types were designed to all have positive descriptions. This means they don't really convey information about goodness and badness very well. And goodness and badness is the most important thing people seem to base their judgments about how similar a character is to them on. Given that matching characters was not the purpose that the Myers-Briggs personality types were developed for, the fact that they do not perform well at it does not really debunk the idea of the 16 types directly. But many people on the internet have suggested that looking up what characters have the same type as you is highly meaningful. I would point to this as another example of the common phenomenon where people dramatically overestimate how useful categorizing by Myers-Briggs types is.
CharacTour
There is a different website with a tool pretty similar to this one called CharacTour. It also has a database of characters and a quiz that searches for matches. A comparison between them has been organized on Reddit, which uses what I think is a good method. The redditors would take both the CharacTour quiz and our quiz pretending to be a specific fictional character. Whichever quiz ranked the character they were pretending to be higher up in its results page (after correcting for total number of options) was considered the winner of that match up. Reddit volunteers conducted a total of 33 different tests using this method, and the SWCPQ was the more accurate one in 27 of the 33 (see the thread on r/SampleSize; archive.is). This suggests that the quiz on this website has a better matching procedure, though an n=33 is a modest sample size.
Resources
The data from the surveys used to develop is available for download.