A substantial number of surveys have been run within the polyamory community. Most notably the 2012 Loving More Survey. These surveys have acquired their respondents from polyamory websites, email lists and forms and may thus be biased towards the type of person who is actively involved in the polyamory community, which may be different than those who simply practice polyamory. To this date, no large survey of general respondents has been run with questions about polyamory.
To fill this need, a survey of users of this website was conducted that asked about demographics and about polyamory/monogamy. For those not familiar with polyamory, the definition from Wikipedia was provided. In October 2015, 5043 responses to this survey were recorded.
At the end of they survey users were asked if their responses were accurate and could be stored and used for research. This analysis only uses those who answered yes to this question and were older than 13.
Do you self-identify as "polyamorous"?
From this question the respondent was categorized as "Not polyamorous", "Used to be polyamorous", "Not polyamorous, but interested", or "Polyamorous". The portions who gave each response are broken out in the pie-chart below.
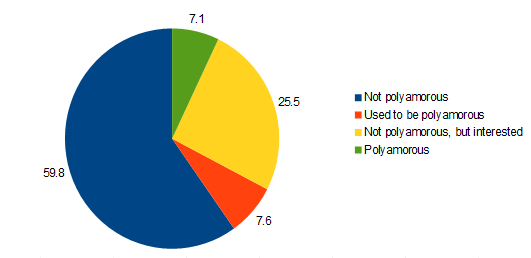
The number of people reporting being polyamorous was somewhat higher than expected. This is likely explained by some bias in the sample. The sample is subjects who take on-line personality tests, they tend to skew a bit more young, liberal, atheist and non-heterosexual than the general population.
Respondents were asked their gender with the options male, female and other. Only users who answered male or female are included in this analysis due to sample size issues.
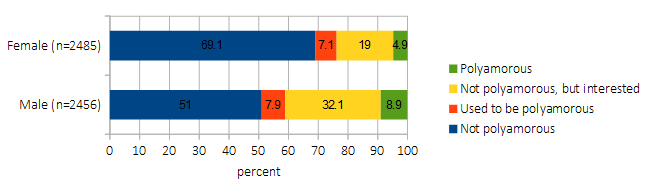
Men were almost twice as likely to say they are polyamorous or want to be polyamorous.
Respondents were asked to enter their age in years, this analysis focuses on four age ranges where there were enough respondents to run statistics.
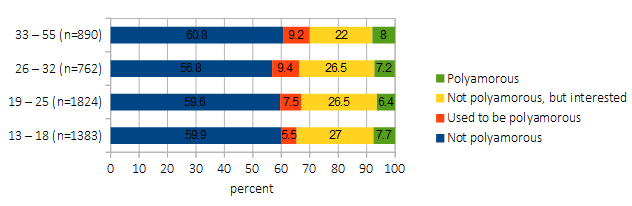
There were not any significant trends in polyamory by age, except that people who said they used to be polyamorous but are not any more increases with age. Which makes sense.
Participants were asked to select their race from eight options: Asian, Arab, Black, Indigenous Australian, Native American, White (hispanic), White (non-hispanic), and other. Due to samples size issues, only statistics for Asians, Blacks and Hispanic and non-Hispanic whites are reported in this analysis.
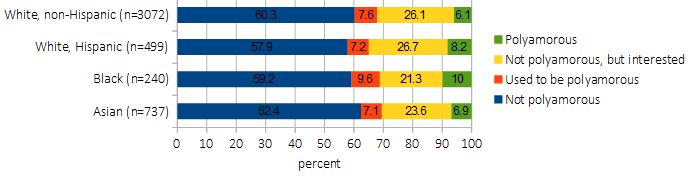
There were not any major trends in polyamory by race.
Participants were asked to select their sexual orientation from five options: heterosexual, bisexual, homosexual, asexual, or other. Due to sample size issues, statistics are only reported here for heterosexuals, bisexuals and homosexuals.
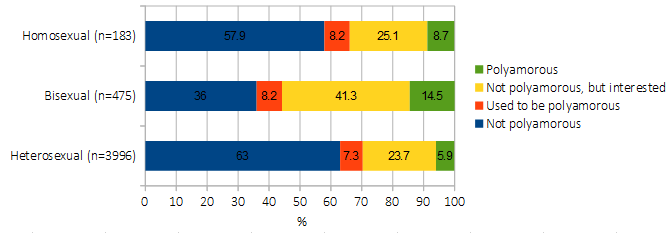
Bisexuals were much more likely to be currently, or interested in being, poly.
Participants were asked to select their religion from nine choices: Atheist/Agnostic, Buddhist, Christian, Muslim, Hindu, Jewish, Shinto, Sikh, or other. Only religions with at least 100 subjects are in the graph below.
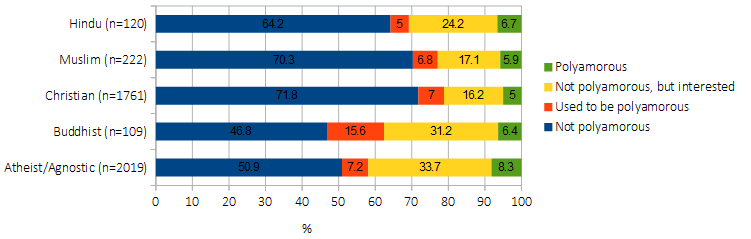
Polyamory was comparatively more common in the irreligious and Buddhist and lower in the Abrahamic religions.
