These are the results from the Firstborn Personality Scale.
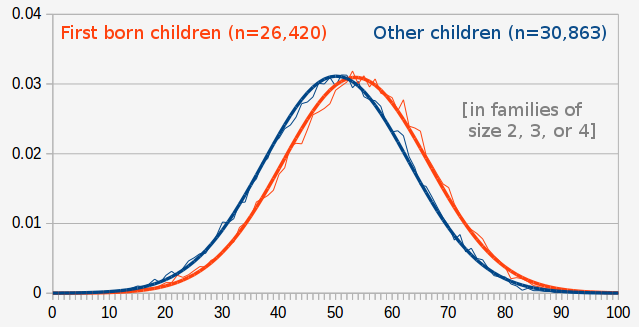
Your score was / 100. Higher scores indicate more "firstborn personality", the traits that are more common in first born children. The average first born scores 53.49, and the average score a later born gets is 50.12. The graph of the distributions is below, showing what portion of both groups get each score.

As you can see, the difference is extremely small. The many claims about how important birth order is for the development of personality appear to be wrong.
How exactly to describe this cluster of differences is up to debate. Some representative items are in the table below.
| Items rated higher by first born children | Items rated higher by later born children |
|---|---|
|
|
You might wonder then if there are other aspects of personality that might show larger differences that have just been missed by this test, but that seems unlikely. To develop this scale, 375 questions were tested and the 25 that showed the largest difference were used here. The questions on this scale are most similar to the big five personality trait of Openness to Experience, which the best academic research has reported is the only one of the big five personality traits to be associated with birth order (see Rohrer et. al., 2014). But the differences on the Firstborn Personality Scale are about twice as big as those reported for Openness.
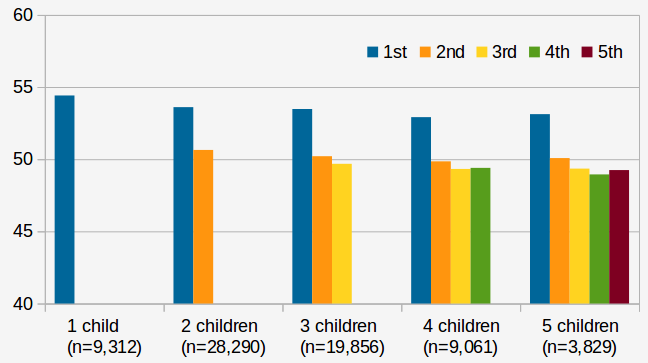
A question you may have is why the focus only on firstborns. Claims about the importance of birth order usually describe a personality type for each position of child (e.g. 'firstborns are like X, middle borns are like Y, youngest children are like Z'). But the data indicates that this is not the case. The only real difference is between first born children and all others. The graph below shows the average scores on this scale by birth order in families of various sizes.

You can see that most of the difference is between first born and later born children.
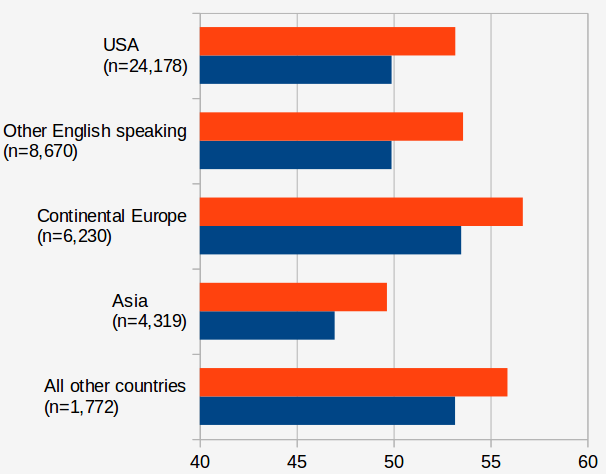
Also, you may be interested in whether this is a thing specific to a certain culture. Looking across cultures, the effect seems to be present everywhere. The graph below shows the average score of people by birth order for various regions of the world.

It seems like the difference between first and second borns is consistent across cultures.
Comments
To return to the main page where other personality tests can be taken, click here.