These are the results from the Open Enneagram of Personality Scales. The calculated scores for each type are shown below.
Your highest score was for Type 9.
Basics of enneagram theory
In ennegram theory, the reason why personality types exist is that early in life people try different strategies to get their needs met and protect themselves from pain. The strategy that ends up working for them first becomes their go-to, a self-reinforcing habit that constrains their identity and produces a variety of behaviors and internal experiences. The nine types are the different strategies, each revolving around a core want and basic fear.
| Type | Common name | Core Premise |
|---|---|---|
| 1 | "The Reformer" | Wants to be good, right, and ethical
Fears being corrupt or defective |
| 2 | "The Helper" | Wants to be loved and needed Fears being unwanted |
| 3 | "The Achiever" | Wants to be successful and admired Fears being worthless, unremarkable |
| 4 | "The Individualist" | Wants to be unique and true to themselves Fears having no identity or significance |
| 5 | "The Investigator" | Wants to be capable and knowledgeable Fears being incompetent or ineffective |
| 6 | "The Loyalist" | Wants security and support Fears being abandoned and unable to survive |
| 7 | "The Enthusiast" | Wants freedom and happiness Fears being trapped in pain or deprivation |
| 8 | "The Challenger" | Wants to be strong and in control Fears being harmed or controlled by others |
| 9 | "The Peacemaker" | Wants inner stability and harmony Fears conflict and disconnection |

A second essential piece of enneagram theory is the enneagram figure, which is held to show that each type can grow to take on the positive traits of a specific other type when they achive personal growth (integration), or regress to the negative traits of another type under stress (disintegration).
| Type | Integration | Disintegration |
|---|---|---|
| 1 | → 7 | → 4 |
| 2 | → 4 | → 8 |
| 3 | → 6 | → 9 |
| 4 | → 1 | → 2 |
| 5 | → 8 | → 7 |
| 6 | → 9 | → 3 |
| 7 | → 5 | → 1 |
| 8 | → 2 | → 5 |
| 9 | → 3 | → 6 |
Type descriptions
There are a number of descriptions of your type on the internet. Here are a few:If you want to explore what personality traits each of the types have, I have built a tool that breaks down real data collected on this website: Personality Type and Personality Trait Correlations Explorer.
Type frequency
You might want to know how common your type is. The graph below shows the frequency of self-reported types you get from asking people, using data from two different surveys on this website. This is **self-identification data** (not computed test results).
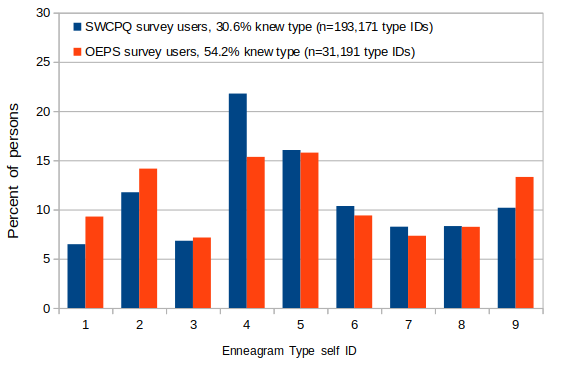
The OEPS survey is this test you just took (in the optional research survey section), and the other survey that has this data was attached to the Statistical "Which Character" Personality Quiz.
The distributions were broadly similar in both surveys. Note that more than half the people who took this test already could say what they thought their type was. The SWCPQ which is unrelated to the ennegram, had a lower rate of people knowing their type (which makes sense).