Development of the Inventory of Phonetic Associations
This page documents the development of the Inventory of Phonetic Associations. The interactive version can be found here.
Background

The "bouba/kiki effect" is a very well known effect in linguistics, where people make associations between shape and sound in non-arbitrary ways. The classic example is to take a rounded shape and a spiky shape (like the ones pictured to the right) and ask which of these is "bouba" and which is "kiki". People show an overwhelming preference to pair these words to the shapes in one specific way. Typically 90%+ say the rounded shape is bouba. And this has been observed in people from all languages all over the world, so it does seem to come from something fundamental about how people process sound and meaning (as opposed to coming from the norms of a speicific language or culture). Read more about it on Wikipedia.
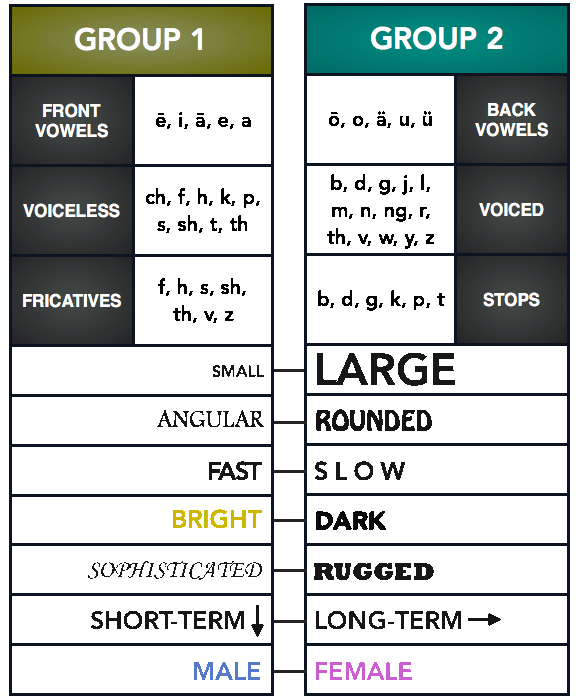
One interesting claim about this effect is that individual differences in the strength of this effect can measure individual psychological differences. It has been reported in several studies that in samples of individuals diagnosed with autism the Boubka/kiki effect is much less strong, and self-reported measures of autism have been correlated with selecting the normal answers on bouba/kiki questions (Gold and Segal, 2017). I looked into this years ago (c. 2013) with the idea of it would be interesting to have a non self-report measure of austism severity, which maybe you could make by having an insturment with a whole lot of different shape / sound association questions. This never made it very far, because the process of empirically testing shape word pairs for reliable associations was slowed to a crawl by my poor graphic design skills. Recently though (c. 2020) I was turned back on to this question by learning about the naming process marketed by Nick Kolenda (via Spencer Greenbergs replication), which claims the sounds have inherant meanings and you should give your company an abstract name that fits with its product. His main claim of interest was that there are a whole bunch of different associations that all align as pictured in the graphic he made below:
To investigate if there is a reliable structure to word associations like this, as survey was deployed on this website. Users were promted with a word and then given a two option force choice of what they associated with it. How this looked to the user was shown below.
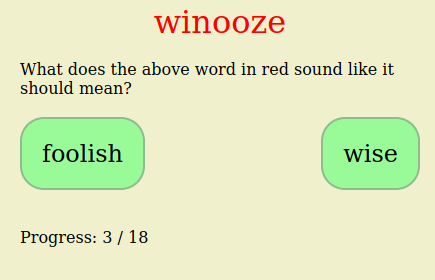
The whole experiment had 100 force choiced meaning items (e.g. "happy" vs "sad") and 599 fake words (~150 taken from Greenberg's experiment, ~350 made by author, ~100 from wordgenerator.net). And 326,686 volunteer raters sourced from this website were used to calculate the association between each fictional word and force choice meaning pairs.
This can be used to examine Kolenda's claim. Kolenda says that words that people think mean large, also sound like they mean long term. The chart below shows the relation between what percent of people choose a given option on the two different prompts small/large and short-term/long-term. Each datapoint in an individual fake word, the two most extreme words are labeld.
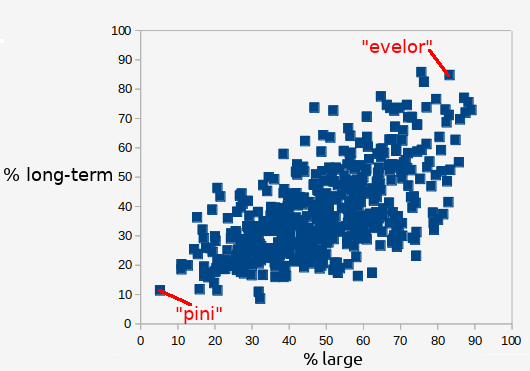
You can see there is a pretty good correlation (r=0.63). Words that people think sound like they should mean long-term also seem like they should mean large. So Kolenda is right so far. His chart also says that words that sound like they mean long-term also sound like they mean dark. The chart for those two associations is below.
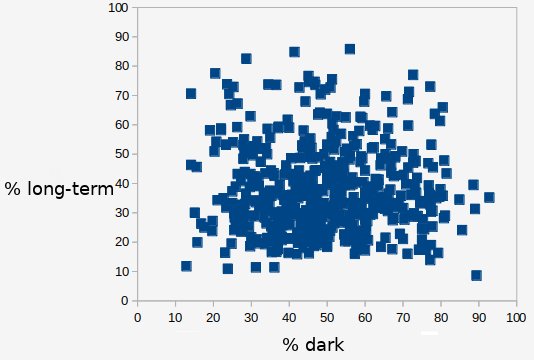
Here there does not seem to be a connection (r=-0.004). So Kolenda's claim is inconsistent to this here.
My impression is that Kolenda did a good job at pointing out important things, but when he said that all the associations were made for the same reason he oversimplified. If you use factor analysis to boil down the the 100 different associations, it looks like maybe there are 5 different effects happening. The table below shows examples of which associations tap into the effect and which words show associations with those words.
| Effect 1 | Effect 2 | Effect 3 | Effect 4 | Effect 5 | |||||
|---|---|---|---|---|---|---|---|---|---|
|
happy<--->sad fun<--->boring bright<--->dark |
cheap<--->expensive basic<--->fancy common<--->rare |
organized<--->chaotic proper<--->scandalous sane<--->crazy |
small<--->large quiet<--->loud thin<--->thick |
soft<--->hard chewy<--->crunchy rounded<--->angular |
|||||
| yaha, yoyiya, sasa, giddin | mog, dur, nob, scult | tump, moop, thub, dun | zapinor, evelor, evela, astabar | prolan, sav, lini, janu | jokser, looz, scremen, howow | siln, pini, niw, sif | gorgenfol, bult, bogr, gurang | bub, bouba, wub, fulf | vik, gike, kreev, calkang |
We see that the factor I have labeled "Effect 5" seems to be the Bouba-Kiki effect, and interestingly in my data it was evinced most strongly by the choice "soft" vs "hard" rather than "angular" vs "rounded" which are usually used.
But looking at graphs of the relations there seems to be some non-linear stuff going on, which world make factor analysis an inappropriate choice for describing the structure of sound-meaning association.
This is left as an exercise to the reader (data is availible for download), because it is not the main focus of this project. What we are interested in now that we have a bunch of reliable word-meaning items that shows a strong and consistent bias is: can these items be used to measure any psychological variables? And in particular, can people's responses to word-meaning items be used to indicate autism, as the previous research about the bouba-kiki effect has hinted?