Correlation between the Wechsler Adult Intelligence Scale and Raven's Progressive Matrices
This page collects information on the correlation between two different IQ tests to answer the question how strongly do different IQ tests correlate with each other?
The two tests chosen to focus on here are the Wechsler Adult Intelligence Scale (WAIS) and Raven's Progressive Matrices (RPM) on the basis that they seem to be the two most well-known tests. The graph below shows the number of page views 10 different Wikipedia articles received in 2018.
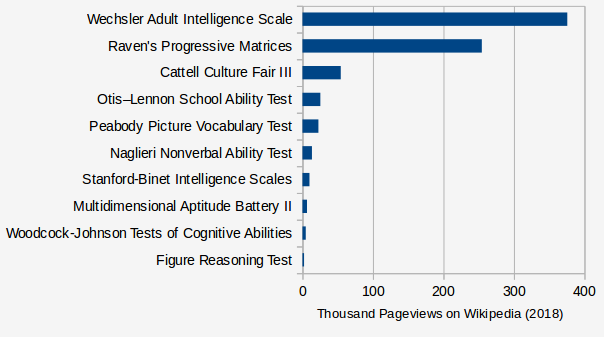
The WAIS and RPM are clearly dominant in terms of interest. And in general these are the two tests people think of when they think of IQ tests, so examining what correlation you should expect from them is useful.
Literature review
A search for articles that reported correlations between WAIS and RPM scores was conducted using Google Scholar. The table below contains the data extracted from them.
|
Citation
|
WAIS version
|
Raven's version
|
n
|
r
|
Sample population
|
| Kizik, 1962 |
WAIS |
SPM |
40 |
0.43 |
College students |
| McLeod et. al., 1962 |
WAIS |
SPM |
81 |
0.67 |
Psychiatric hospital patients |
| Sydiaha, 1967 |
WAIS |
SPM |
40 |
0.607 |
Psychiatric hospital patients |
| Shaw, 1967 |
WAIS |
SPM |
83 |
0.83 |
Psychiatric hospital patients |
| Pringle, 1971 |
WAIS |
SPM |
63 |
0.77 |
Psychiatric hospital patients |
| McLaurin et. al., 1973 |
WAIS |
SPM |
131 |
0.55 |
College students |
| Watson et. al., 1974 |
WAIS |
SPM |
120 |
0.58 |
Psychiatric hospital patients |
| Vernon, 1983 |
WAIS |
APM |
100 |
0.72 |
College students |
| Burke, 1985 |
WAIS |
SPM |
256 |
0.66 |
Veterans undergoing treatment and career counseling |
| Paul, 1986 |
WAIS |
SPM |
62 |
0.69 |
College students |
| O'Leary et. al., 1991 |
WAIS |
SPM |
105
105
36
25
17
20 |
.74
.77
.79
.83
.84
.11 |
Psychiatric hospital patients |
| Rijsdijk et. al., 2002 |
WAIS |
SPM |
388 |
0.66 |
Twin study at 18 y.o. |
Not that much time was spent, so its possible a much more comprehensive search would find many more articles, but these should be enough to give a reasonable estimate.
Implications
The weighted average of all the correlations found in the literature review between the WAIS and RPM was 0.67.
If we assume that this is the true value and that IQ scores are normally distributed like they are supposed to be, the average expected difference between the two scores an individual would receive if they took both is 9.7 points. And the differences would conform to the distribution graphed below.
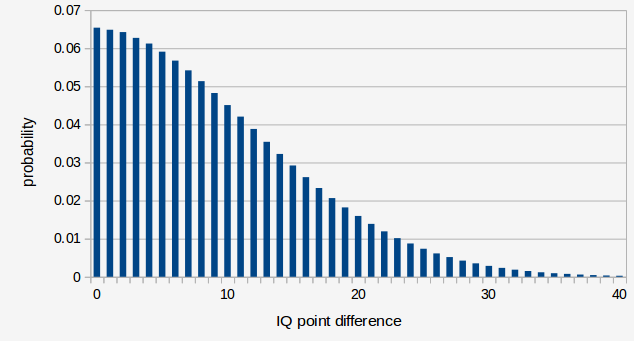
This was simulated using the code at two-iq-simulation.py.
Final notes
If you know of any more studies that report a correlation between the WAIS and RPM, please share!
Public discussion