Survey Topic Participation Bias
There is this thing I have decided to call "survey topic participation bias". If you have a survey about a specific thing, people who have more of that specific thing are more likely to take that survey. It depends somewhat on the exact dynamics of the situation, but works well as a general rule. This is extremely important to account for when offering a survey that provides feedback that normalizes scores or compares them to other people who have taken the survey. Most online interactive surveys do not do this, so their results may be misleading.
For example, this website had an interactive version of the Depression Anxiety Stress Scales for a period of time. The graph below shows how the users who took it here scored versus a large sample from Crawford and Henry (2003) of UK adults.
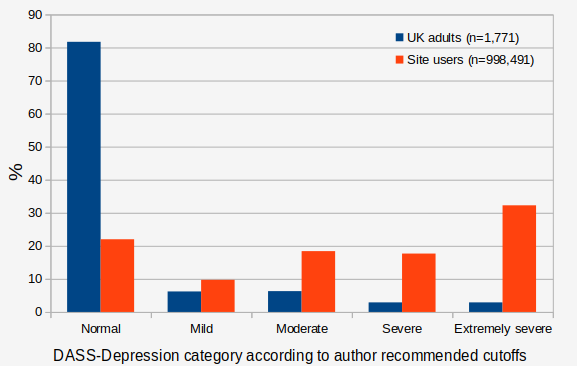
You can see that users on this site scored massively higher than the community sample. The community itself must not be perfectly representative of the "general population" and there are multiple reasons why the two samples have different score distributions, but I think the main reason is the bias I am talking about here. People who think they are depressed are much more motivated to take a test to find out just exactly how depressed they are.
This bias is most acute for topics where there is discrete identity people can adopt versus normalcy (e.g. a diagnosis), but it appears for basically anything you can ask a question on or try to assess. The Dark Triad Personality Test (using the SD3 from Jones and Paulhus, 2014) on this website measures the three traits of machiavellianism, narcissism, and psychopathy. The graph below shows the distribution of psychopathy scores versus the estimated distribution of US adults from an ad-hoc meta-analysis (see here).
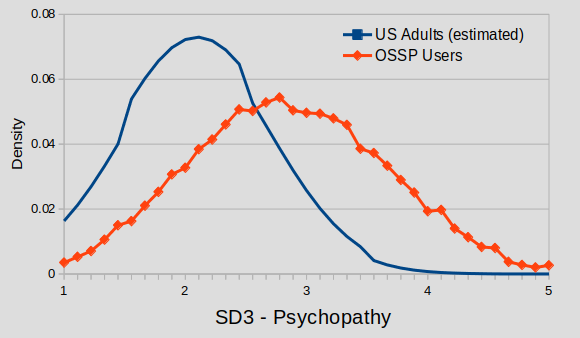
Psychopathy scores calculated by the test on this website were much higher, because people who think they are a dark triad bad boy are more interested in seeing how high their scores are than people who don't think its cool to be that way.
This happens for non-self report things as well. The chart below shows the self reported ACT scores of people who took an IQ test on this website versus what ACT, Inc. reports was the complete distribution of scores of people who took its test in 2020.

Again, there are a number of reasons why the distribution is not the same. Self-reported ACT scores are affected by several biases. But I think the main thing happening is that people who expect to get good results (based on past experience taking tests) are more motivated to take tests.
I testify that this happens for basically every single survey on this website.
One alternate explanation that must be addressed is that some or all of the differences in samples could be from the effect of internet population versus not. e.g. perhaps all people on the internet are more depressed, psychopathic, good at multiple choice questions than everyone in the community and this is why the distributions are different rather than motivational effects due to each different topic. We can address this by looking at personality scores of users across different tests on this website. The Ten Item Personality Inventory is a short Big 5 measure that has been attached to the end of multiple different tests on this website, it also has been used in some big longitudinal studies so we can use those as almost a population norm.
The graph below shows scores on the TIPI Extraversion scale from the samples of people who took 2 different tests on this website and people in the National Longitudinal Survey of Youth 1979 (a big longitudinal study in the USA where care was taken to make it representative).
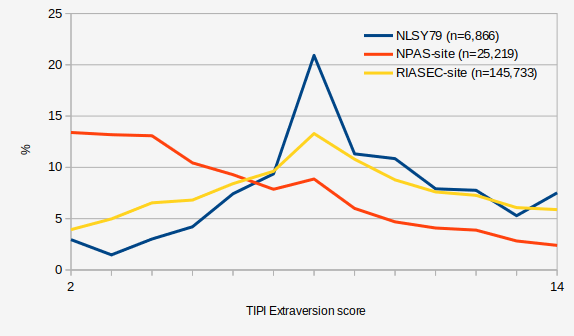
You can see that people who took the Holland Codes (RIASEC) Test, a measure that is used for career counseling, had extraversion scores that were similar in distribution to the community sample. But users who took the Nerdy Personality Attributes Scale (NPAS) scored significantly lower than the community sample. This is presumably because people taking the NPAS were motivated to do so to validate their identity as a nerd (and nerdiness is negatively correlated with extraversion), while the motivational filtering due to being interested in careers (I don't know what that is, but assume it exists in some way) is unrelated to extraversion.
One of the reasons why this is important (and the reason why this write up exists) is that when offering a psychological survey that provides results at the end, it is useful to give some information about how other people score on the survey to help users interpret their results. Nearly every test on this website provides percentiles scores in addition to raw scores. The easiest way to generate percentile scores when creating such a survey is to calculate them from the other people who have taken the survey. This can end up being very misleading, due to the biased named on this page. For example, on the Short Dark Triad, a score of 4.0/5 for machiavellianism is 62nd percentile relative to other users. So this score would seem to be in the average range if you based it just on that. But if you look at some other more general population samples from the research literature a 4.0/5 is at the 94th percentile relative to them, so such a score should actually be considered to be in the high range!
This bias also has some other implications. A lot of the data collected by this website is shared publicly, and so the fact that the participants in the dataset have been selected somewhat for higher levels of the traits that are being measured should be kept in mind when analyzing it. I actually don't think that data from this website is any more biased overall that data from different sources, as all sources of data have their own biases (college undergrads are not exactly representative of the population either). Though the bias in data from this website tends to take a different pattern.
And more generally, this should be kept in mind when designing any research survey where the population level of something is attempting to be estimated. I have observed that activist organizations often take advantage of this bias to exaggerate the prevalence of the particular problem they care about. When a survey is advertised like "We want to know your experiences with [Social Problem X]", people who have experience with [Social Problem X] are much more likely to participate. This can be complicated though. Chris Hydock and Kurt Carlson (2017) studied how consumer satisfaction surveys can be biased and found that bias could be both ways depending on the exact dynamics and motivations created by the situation:
"Together the studies reported here indicate that when consumers are able to exit a brand, there is a positive satisfaction response bias for survey completion. In contrast, the results demonstrate that when consumers cannot exit a brand, an extreme satisfaction response bias exists. We additionally demonstrate that survey completion is driven by and obligation to reciprocate and a desire to vent, the latter of which only drives survey completion when a more attractive alternative option (exiting the brand) is not available."
— Satisfaction-Driven Nonresponse Bias in Consumer Feedback Surveys: Venting, Reciprocation and Exiting
Stepping back to put this all in context, Survey Topic Participation Bias can be categorized as a specific type of self-selection bias.
Public discussion
References
- Chris Hydock and Kurt Carlson (2017) ,"Satisfaction-Driven Nonresponse Bias in Consumer Feedback Surveys: Venting,
Reciprocation and Exiting", in NA - Advances in Consumer Research Volume 45, eds. Ayelet Gneezy, Vladas Griskevicius, and
Patti Williams, Duluth, MN : Association for Consumer Research, Pages: 679-682.
- Crawford, John R., and Julie D. Henry. "The Depression Anxiety Stress Scales (DASS): Normative data and latent structure in a large non‐clinical sample." British journal of clinical psychology 42.2 (2003): 111-131.