The interactive version of the Nonverbal Immediacy Scale on this website has been collecting data since 2016. Internet users have been taking the test primary for fun and have had the option to donate their data for research, and also to complete a supplemental research survey. This article summarises various statistical relationships found in the data that can be useful for understanding and using the Nonverbal Immediacy Scale. This articles uses the data from 115,323 subjects who completed the scale and a subset of 61,989 of those who also completed the supplemental survey.
Scores on the NIS range from 26 (1 on every item*) to 130 (5 on every item*). *after reverse scoring is taken into account
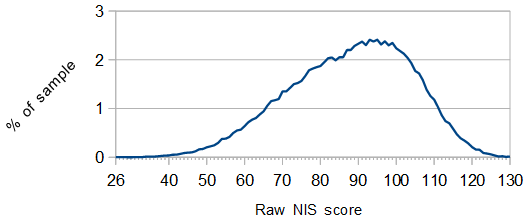
The average score was 87.57 (with a standard deviation of 15.7). This is a much lower average reported by some other articles. This is presumable due to the test's popularity among socially awkward sections of the internet.
At the end of the survey subjects were asked to report their college major (if applicable). The average NIS score for each major with can be seen in the graph below (only majors with data from at least 200 subjects).
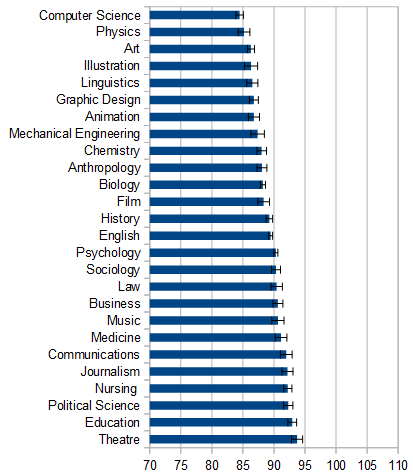
The scores for nonverbal immediacy mostly aligned with stereotypes. The lowest scores were found in the technical fields. The highest scores were found in theatre which makes sense as non-verbal communication is extremely important for performance and much of theatre training is specifically on how to do behaviours that fall under the umbrella of non-verbal immediacy.
Subjects were asked to report their age in years. Average score by age for subjects of ages 13-60 are graphed below.
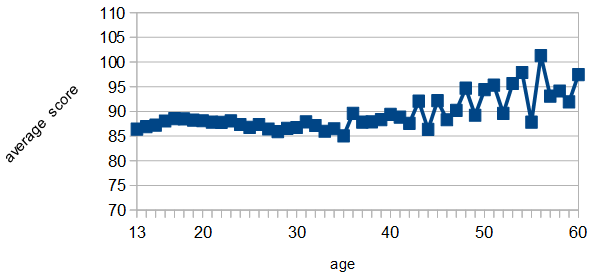
There appears to be a peak in adolescence followed by a dip in early adulthood and then trend upwards into old age. The magnitude of these changes is very small though and so can not be generalized with confidence (e.g its possible that this is just from sample bias with younger and older participants coming from different sources).
Subjects were asked to report their gender.
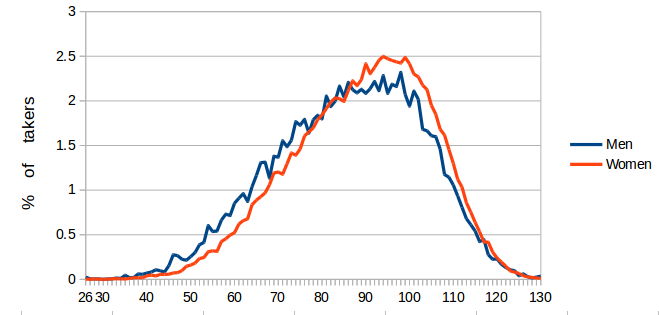
Women scored higher than men, but only marginally. There is almost complete overlap in the score distributions.
Subjects were asked to report their gender and sexual orientation. Nonverbal Immediacy is disaggregated by both in the graph below.
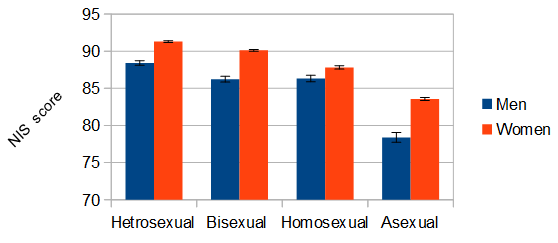
Women showed more non-verbal immediacy than men and asexual people showed much less non-verbal immediacy than others.
The survey contained a brief vocabulary assessment. To save time it was not a vocabulary test where users had to pick correct answers, just a checklist where users were instructed to select every word they knew. The checklist contained several validity questions (words that were not words and words that everyone should know); only users who passed the validity check are used for the graph below. Scores go up to 13, higher scores indicate more vocabulary knowledge.
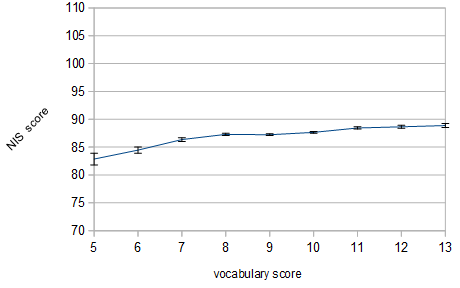
Individuals with better vocabulary also displayed slightly more non-verbal immediacy.
The supplemental survey also contained a measure of the big five personality traits, the Ten Item Personality Inventory For more information about the big five traits, see our test here.
The correlation of each trait with the NIS score is in the table below. All correlations were statistically significant due to sample size.
| Trait | Correlation |
|---|---|
| Extroversion | 0.57 |
| Agreeableness | 0.33 |
| Conscientiousness | 0.14 |
| Neuroticism | -0.25 |
| Openness to experience | 0.31 |
Nonverbal immediacy was was associated with being more outgoing and friendly. The only unexpected correlation was perhaps with openness to experience.
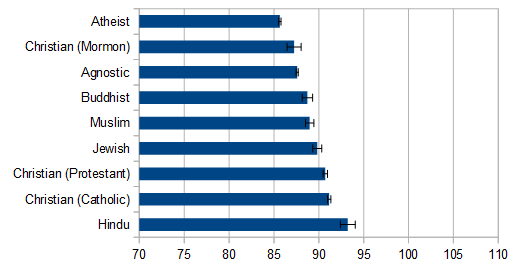
Subjects were asked to about their religion. See the graph below.
Subjects were asked to about what sort of area they lived in when they were growing up. See the graph below.
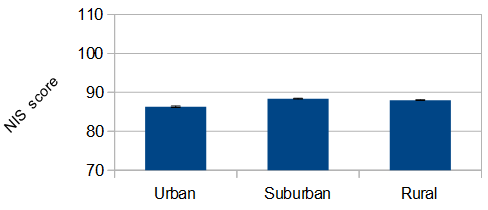
People who grew up in cities more standoffish. This fits with, for example, New York City stereotypes.
